Yellow-rumped Thornbill
Acanthiza chrysorrhoa
ABR description
The following is extracted from the Annual Bird Report for the twelve months to June 2017.
Very common, breeding resident
An easily recognised ground feeding bird of open forests, urban parks and suburban streets and gardens.
General: More records (2093) than last year but from fewer grid cells (48%) for all weeks. Number of birds recorded (10758) down 8% on last year. Reporting rate (14.8%) is well below the 30YA (23.5%). Max 55/23 Jun LGeo E (LeM1), mean 5.3, and median 4. Records distributed evenly throughout the year, with slightly fewer in autumn (21%). 54 breeding records from 25 grid cells: first nb/17 Jul Gungahlin Hill NR (CoF1) and latest dy/8 Jan Mt Ainslie NR (HoS1) with an early start to next season nb/22 Jun Campbell Park (HoS1).
GBS: 351 records from 35 sites (59%) in all weeks. Abundance (A=0.5533) was lower than the previous year continuing a downward trend from A=1.5 in 2009, and less than half the 10 and 30YAs. Mean 4.0, median 3 and max 30/4wk May Crace (LeF1). 16 breeding records from 3 sites with 8 records from Curtin (AjR1) with first nb/4wk Aug Curtin (AjR1) and last dy/2wk Jan Page (AlB1).

Abundance
Abundance is the average number of birds of that species per survey. Where the species was observed (presence recorded) but the number of birds seen was not recorded, this is treated as a count of zero.
Abundance by year
This chart shows the abundance of Yellow-rumped Thornbill between 1982 and 2017. 
Abundance by month
This chart shows the monthly abundance of Yellow-rumped Thornbill. The blue lines show the abundance for the twelve months to June 2017 and the bars show the average abundance for the period 1982 to 2017. 
Abundance by season
This chart shows the seasonal abundance of Yellow-rumped Thornbill. The blue lines show the seasonal abundance for the twelve months to June 2017 and the bars show the average seasonal abundance for the period 1982 to 2017. 
Abundance data
| Month | Season | ||||||||||||||||||
|---|---|---|---|---|---|---|---|---|---|---|---|---|---|---|---|---|---|---|---|
| Period | Jul | Aug | Sep | Oct | Nov | Dec | Jan | Feb | Mar | Apr | May | Jun | Winter | Spring | Summer | Autumn | All | ||
| All years | |||||||||||||||||||
| All | 1.5 | 1.1 | 0.8 | 0.8 | 0.7 | 0.6 | 0.7 | 0.8 | 0.9 | 1.3 | 1.4 | 1.2 | 1.3 | 0.8 | 0.7 | 1.2 | 1.0 | ||
| Previous years | |||||||||||||||||||
| All previous years | 1.5 | 1.1 | 0.8 | 0.9 | 0.7 | 0.7 | 0.7 | 0.8 | 0.9 | 1.3 | 1.6 | 1.3 | 1.3 | 0.8 | 0.7 | 1.2 | 1.0 | ||
| Previous 30 years | 1.5 | 1.1 | 0.8 | 0.9 | 0.7 | 0.7 | 0.7 | 0.8 | 0.9 | 1.3 | 1.6 | 1.3 | 1.3 | 0.8 | 0.7 | 1.2 | 1.0 | ||
| Previous 20 years | 1.6 | 1.3 | 0.8 | 0.9 | 0.7 | 0.7 | 0.8 | 0.9 | 0.9 | 1.3 | 1.6 | 1.3 | 1.4 | 0.8 | 0.8 | 1.2 | 1.0 | ||
| 10 year groups | |||||||||||||||||||
| [2007,2017) | 1.9 | 1.4 | 0.9 | 0.9 | 0.8 | 0.7 | 0.8 | 0.9 | 0.9 | 1.4 | 1.7 | 1.5 | 1.6 | 0.9 | 0.8 | 1.3 | 1.1 | ||
| [1997,2007) | 1.2 | 0.9 | 0.7 | 0.7 | 0.5 | 0.5 | 0.8 | 0.8 | 0.8 | 1.2 | 1.4 | 1.0 | 1.0 | 0.6 | 0.6 | 1.1 | 0.8 | ||
| [1987,1997) | 1.1 | 0.7 | 0.8 | 0.8 | 0.7 | 0.7 | 0.6 | 0.7 | 1.1 | 1.2 | 1.4 | 1.1 | 1.0 | 0.7 | 0.6 | 1.3 | 0.9 | ||
| 5 year groups | |||||||||||||||||||
| [2012,2017) | 1.9 | 1.4 | 0.8 | 0.8 | 0.8 | 0.8 | 0.7 | 0.8 | 0.9 | 1.3 | 1.5 | 1.3 | 1.5 | 0.8 | 0.7 | 1.2 | 1.0 | ||
| [2007,2012) | 1.7 | 1.5 | 1.1 | 1.1 | 1.0 | 0.7 | 1.1 | 1.3 | 1.0 | 1.5 | 2.4 | 1.7 | 1.7 | 1.1 | 1.0 | 1.5 | 1.3 | ||
| [2002,2007) | 1.1 | 1.0 | 0.7 | 0.7 | 0.5 | 0.4 | 0.8 | 0.9 | 0.9 | 1.2 | 1.2 | 1.0 | 1.1 | 0.6 | 0.7 | 1.1 | 0.8 | ||
| [1997,2002) | 1.3 | 0.8 | 0.7 | 0.6 | 0.6 | 0.5 | 0.8 | 0.7 | 0.7 | 1.2 | 1.6 | 0.9 | 1.0 | 0.6 | 0.6 | 1.1 | 0.8 | ||
| [1992,1997) | 2.0 | 0.9 | 1.0 | 1.0 | 0.9 | 0.9 | 0.7 | 0.8 | 1.2 | 1.5 | 2.0 | 1.2 | 1.3 | 1.0 | 0.8 | 1.5 | 1.2 | ||
| [1987,1992) | 0.7 | 0.6 | 0.6 | 0.6 | 0.5 | 0.6 | 0.5 | 0.6 | 1.1 | 1.1 | 1.1 | 1.1 | 0.8 | 0.6 | 0.6 | 1.1 | 0.8 | ||
| Year | |||||||||||||||||||
| 2017 | 1.4 | 1.2 | 0.7 | 0.6 | 0.5 | 0.5 | 0.6 | 0.6 | 0.6 | 0.9 | 0.8 | 1.0 | 1.2 | 0.6 | 0.6 | 0.8 | 0.8 | ||
| 2016 | 2.1 | 1.3 | 0.9 | 0.8 | 0.8 | 0.8 | 0.8 | 0.7 | 0.9 | 1.2 | 1.2 | 1.2 | 1.5 | 0.8 | 0.8 | 1.1 | 1.0 | ||
| 2015 | 1.3 | 1.1 | 0.9 | 0.8 | 0.8 | 0.8 | 0.7 | 0.9 | 0.8 | 1.2 | 1.5 | 1.4 | 1.3 | 0.8 | 0.8 | 1.1 | 1.0 | ||
| 2014 | 1.6 | 1.4 | 0.6 | 0.7 | 0.7 | 0.8 | 0.7 | 1.1 | 1.2 | 1.9 | 1.6 | 1.3 | 1.4 | 0.7 | 0.8 | 1.5 | 1.1 | ||
| 2013 | 1.9 | 2.2 | 0.8 | 0.8 | 0.8 | 0.7 | 0.6 | 0.7 | 0.6 | 1.1 | 2.1 | 1.1 | 1.7 | 0.8 | 0.7 | 1.1 | 1.0 | ||
| 2012 | 2.7 | 1.4 | 0.9 | 0.9 | 0.7 | 0.7 | 0.4 | 0.7 | 0.9 | 1.6 | 1.8 | 1.7 | 1.9 | 0.9 | 0.6 | 1.3 | 1.1 | ||
| 2011 | 2.4 | 1.7 | 1.9 | 1.7 | 1.6 | 0.6 | 1.4 | 0.9 | 0.7 | 1.5 | 1.5 | 1.6 | 1.8 | 1.7 | 0.9 | 1.2 | 1.4 | ||
| 2010 | 3.3 | 1.7 | 1.1 | 1.2 | 0.9 | 1.0 | 1.1 | 1.5 | 1.0 | 1.6 | 3.2 | 1.9 | 2.1 | 1.1 | 1.1 | 1.6 | 1.4 | ||
| 2009 | 0.9 | 1.8 | 0.9 | 1.1 | 0.8 | 0.8 | 0.9 | 1.2 | 1.6 | 1.8 | 2.6 | 2.3 | 1.8 | 1.0 | 0.9 | 1.9 | 1.3 | ||
| 2008 | 1.3 | 1.2 | 0.9 | 0.8 | 1.0 | 0.5 | 0.9 | 1.2 | 1.4 | 1.1 | 2.5 | 1.4 | 1.3 | 0.9 | 0.8 | 1.4 | 1.1 | ||
| 2007 | 1.3 | 1.0 | 0.5 | 1.0 | 0.7 | 0.6 | 1.1 | 2.2 | 0.8 | 1.9 | 3.2 | 1.5 | 1.4 | 0.8 | 1.1 | 1.7 | 1.2 | ||
| 2006 | 1.6 | 1.0 | 0.6 | 1.0 | 0.4 | 0.5 | 1.3 | 0.8 | 1.2 | 1.3 | 1.2 | 1.0 | 1.1 | 0.8 | 0.9 | 1.2 | 1.0 | ||
| 2005 | 0.8 | 0.7 | 0.7 | 0.6 | 0.4 | 0.5 | 0.9 | 0.9 | 1.0 | 1.1 | 1.0 | 0.8 | 0.8 | 0.6 | 0.7 | 1.0 | 0.8 | ||
| 2004 | 0.6 | 0.8 | 0.6 | 0.4 | 0.3 | 0.3 | 0.4 | 0.9 | 0.8 | 1.2 | 1.4 | 1.0 | 0.8 | 0.5 | 0.4 | 1.1 | 0.7 | ||
| 2003 | 1.4 | 1.2 | 0.6 | 0.4 | 0.5 | 0.5 | 0.6 | 0.9 | 0.7 | 1.1 | 1.4 | 0.9 | 1.1 | 0.5 | 0.7 | 1.0 | 0.8 | ||
| 2002 | 1.6 | 1.4 | 0.8 | 0.7 | 0.7 | 0.4 | 0.6 | 1.0 | 0.7 | 1.3 | 1.1 | 1.6 | 1.6 | 0.7 | 0.6 | 1.0 | 0.9 | ||
| 2001 | 1.6 | 1.0 | 0.6 | 0.8 | 0.7 | 0.8 | 0.8 | 0.9 | 0.8 | 1.6 | 2.5 | 1.0 | 1.2 | 0.7 | 0.8 | 1.5 | 1.1 | ||
| 2000 | 1.6 | 0.7 | 0.7 | 0.7 | 0.9 | 0.3 | 0.8 | 0.7 | 0.7 | 1.2 | 1.4 | 1.3 | 1.2 | 0.8 | 0.6 | 1.0 | 0.8 | ||
| 1999 | 1.8 | 0.5 | 0.7 | 0.6 | 0.5 | 0.7 | 0.7 | 0.6 | 0.7 | 1.2 | 1.3 | 0.8 | 0.8 | 0.6 | 0.7 | 1.1 | 0.8 | ||
| 1998 | 0.5 | 1.4 | 1.0 | 0.3 | 0.3 | 0.3 | 0.7 | 0.3 | 0.3 | 1.1 | 0.9 | 0.4 | 0.8 | 0.5 | 0.4 | 0.6 | 0.6 | ||
| 1997 | 0.5 | 0.7 | 0.4 | 0.4 | 0.6 | 0.2 | 0.4 | 0.8 | 1.3 | 0.6 | 0.6 | 0.1 | 0.4 | 0.5 | 0.4 | 0.7 | 0.5 | ||
| 1996 | 1.5 | 0.3 | 1.0 | 1.1 | 0.6 | 0.7 | 0.5 | 0.3 | 0.3 | 1.5 | 1.3 | 1.5 | 1.1 | 0.9 | 0.5 | 0.9 | 0.8 | ||
| 1995 | 1.7 | 0.3 | 0.2 | 0.9 | 0.5 | 0.8 | 1.2 | 0.9 | 0.9 | 0.8 | 3.0 | 1.6 | 1.1 | 0.6 | 1.0 | 1.4 | 1.0 | ||
| 1994 | 1.5 | 1.7 | 1.3 | 1.0 | 0.9 | 0.9 | 0.7 | 0.6 | 0.7 | 1.1 | 1.6 | 0.9 | 1.3 | 1.0 | 0.7 | 1.1 | 1.1 | ||
| 1993 | 1.8 | 1.7 | 1.9 | 1.2 | 1.7 | 2.1 | 0.4 | 0.9 | 2.1 | 3.0 | 2.2 | 1.5 | 1.7 | 1.6 | 1.1 | 2.4 | 1.8 | ||
| 1992 | 3.7 | 1.1 | 1.1 | 1.1 | 1.4 | 0.7 | 0.2 | 2.1 | 2.2 | 2.5 | 1.6 | 0.2 | 1.7 | 1.2 | 0.9 | 2.1 | 1.5 | ||
| 1991 | 1.2 | 1.1 | 1.6 | 1.3 | 1.9 | 1.0 | 0.7 | 2.0 | 2.0 | 2.9 | 5.3 | 4.1 | 1.7 | 1.6 | 1.2 | 3.4 | 1.9 | ||
| 1990 | 0.9 | 0.8 | 0.8 | 0.6 | 0.2 | 1.2 | 0.6 | 0.9 | 4.6 | 4.2 | 2.5 | 2.6 | 1.1 | 0.5 | 0.9 | 3.8 | 1.5 | ||
| 1989 | 0.5 | 0.6 | 0.5 | 0.5 | 0.4 | 0.4 | 0.5 | 0.5 | 0.7 | 0.6 | 0.6 | 1.0 | 0.7 | 0.5 | 0.5 | 0.6 | 0.6 | ||
| 1988 | 0.5 | 0.4 | 0.6 | 0.5 | 0.4 | 0.5 | 0.4 | 0.6 | 0.5 | 0.5 | 0.5 | 0.5 | 0.5 | 0.5 | 0.5 | 0.5 | 0.5 | ||
| 1987 | 0.8 | 0.1 | 0.4 | 0.6 | 0.4 | 0.5 | 0.5 | 0.3 | 0.4 | 0.4 | 0.5 | 0.5 | 0.5 | 0.5 | 0.4 | 0.4 | 0.4 | ||
| 1986 | 1.7 | 1.1 | 1.0 | 1.2 | 1.1 | 1.1 | 1.3 | 0.4 | 0.2 | 3.5 | 1.6 | 1.1 | 1.3 | 1.1 | 0.9 | 2.1 | 1.3 | ||
| 1985 | 0.0 | 0.6 | 0.0 | 0.1 | 0.1 | 0.0 | 1.0 | 0.6 | 0.0 | 0.0 | 3.0 | 0.6 | 0.4 | 0.0 | 0.2 | 0.8 | 0.2 | ||
| 1984 | 0.0 | 0.0 | 0.0 | 0.0 | 0.0 | 0.0 | 0.0 | 0.1 | 0.2 | 0.3 | 0.3 | 0.2 | 0.1 | 0.0 | 0.0 | 0.2 | 0.1 | ||
| 1983 | 0.0 | 0.5 | 0.0 | 0.2 | 0.1 | 0.1 | 0.0 | 0.0 | 0.0 | - | 0.0 | 0.0 | 0.2 | 0.1 | 0.0 | 0.0 | 0.1 | ||
| 1982 | - | 0.0 | - | 0.0 | 0.0 | 0.0 | - | 0.0 | - | 0.0 | - | 0.0 | 0.0 | 0.0 | 0.0 | 0.0 | 0.0 | ||
Reporting rates
Reporting rate is the proportion of all surveys in which the species was present.
Reporting rate by year
This chart shows the reporting rate of Yellow-rumped Thornbill each year between 1982 and 2017. 
Reporting rate by month
This chart shows the reporting rate by month of Yellow-rumped Thornbill. The blue lines show the reporting rate for the twelve months to June 2017 and the bars show the average reporting rate for the period 1982 to 2017. 
Reporting rate by season
This chart shows the seasonal reporting rate of Yellow-rumped Thornbill. The blue lines show the seasonal reporting rate for the twelve months to June 2017 and the bars show the average seasonal reporting rate for the period 1982 to 2017. 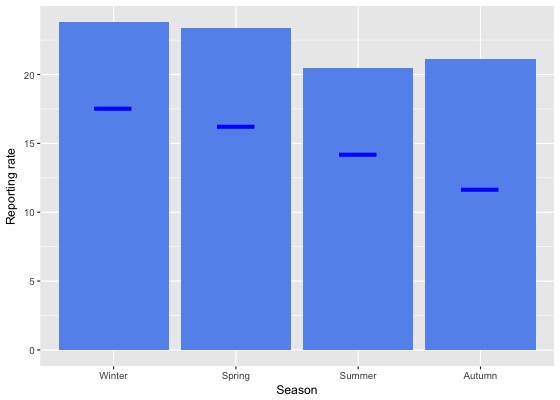
Reporting rate data
| Month | Season | ||||||||||||||||||
|---|---|---|---|---|---|---|---|---|---|---|---|---|---|---|---|---|---|---|---|
| Period | Jul | Aug | Sep | Oct | Nov | Dec | Jan | Feb | Mar | Apr | May | Jun | Winter | Spring | Summer | Autumn | All | ||
| All years | |||||||||||||||||||
| All | 25.5 | 26.5 | 23.8 | 24.0 | 22.0 | 20.0 | 21.5 | 19.7 | 19.1 | 22.3 | 22.6 | 20.6 | 23.8 | 23.4 | 20.5 | 21.2 | 22.2 | ||
| Previous years | |||||||||||||||||||
| All previous years | 26.3 | 27.3 | 24.5 | 24.9 | 23.3 | 20.9 | 22.6 | 21.1 | 20.5 | 23.7 | 25.4 | 22.2 | 24.9 | 24.4 | 21.6 | 22.9 | 23.4 | ||
| Previous 30 years | 26.4 | 27.5 | 24.6 | 25.1 | 23.3 | 21.1 | 22.7 | 21.3 | 20.6 | 23.7 | 25.4 | 22.3 | 25.0 | 24.5 | 21.7 | 23.0 | 23.5 | ||
| Previous 20 years | 23.5 | 25.0 | 22.5 | 23.4 | 20.7 | 18.9 | 21.1 | 19.2 | 18.4 | 21.7 | 22.1 | 19.6 | 22.3 | 22.5 | 19.8 | 20.5 | 21.2 | ||
| 10 year groups | |||||||||||||||||||
| [2007,2017) | 24.4 | 25.4 | 22.5 | 23.4 | 21.9 | 20.3 | 21.0 | 19.3 | 18.5 | 21.1 | 21.5 | 20.6 | 23.0 | 22.8 | 20.3 | 20.2 | 21.5 | ||
| [1997,2007) | 22.0 | 24.1 | 22.5 | 23.2 | 18.5 | 16.0 | 21.5 | 18.9 | 18.2 | 23.4 | 23.5 | 17.5 | 20.7 | 21.6 | 18.4 | 21.2 | 20.5 | ||
| [1987,1997) | 36.6 | 35.1 | 35.2 | 35.3 | 31.9 | 33.7 | 31.5 | 30.9 | 33.2 | 34.1 | 37.7 | 35.7 | 35.8 | 34.0 | 32.1 | 34.9 | 34.2 | ||
| 5 year groups | |||||||||||||||||||
| [2012,2017) | 24.3 | 24.7 | 22.3 | 21.9 | 21.1 | 20.3 | 19.2 | 17.8 | 18.3 | 20.3 | 19.0 | 18.4 | 22.1 | 21.8 | 19.1 | 19.2 | 20.5 | ||
| [2007,2012) | 24.6 | 28.0 | 23.2 | 25.9 | 24.1 | 20.4 | 27.4 | 26.1 | 19.0 | 22.7 | 28.8 | 24.7 | 25.4 | 24.8 | 24.1 | 22.7 | 24.3 | ||
| [2002,2007) | 20.2 | 24.4 | 21.6 | 24.2 | 16.2 | 15.7 | 20.1 | 18.9 | 18.6 | 22.8 | 20.7 | 15.9 | 19.4 | 21.0 | 17.8 | 20.5 | 19.8 | ||
| [1997,2002) | 25.0 | 23.7 | 23.6 | 21.7 | 21.1 | 16.4 | 23.2 | 18.8 | 17.7 | 24.2 | 26.9 | 19.7 | 22.4 | 22.2 | 19.2 | 22.2 | 21.5 | ||
| [1992,1997) | 21.8 | 19.9 | 21.1 | 20.5 | 23.8 | 21.1 | 15.3 | 11.8 | 15.9 | 18.5 | 22.6 | 17.8 | 19.7 | 21.8 | 16.3 | 18.8 | 19.4 | ||
| [1987,1992) | 43.3 | 43.3 | 41.8 | 43.4 | 35.8 | 39.3 | 40.4 | 38.2 | 43.4 | 43.0 | 45.6 | 45.8 | 44.1 | 40.1 | 39.3 | 43.9 | 41.8 | ||
| Year | |||||||||||||||||||
| 2017 | 20.6 | 22.0 | 18.0 | 16.9 | 13.6 | 14.1 | 15.5 | 12.8 | 10.8 | 13.6 | 10.7 | 12.5 | 17.5 | 16.3 | 14.2 | 11.6 | 14.8 | ||
| 2016 | 21.9 | 20.7 | 18.6 | 17.0 | 18.2 | 15.9 | 15.0 | 14.5 | 15.0 | 16.4 | 14.8 | 14.6 | 19.0 | 17.8 | 15.1 | 15.4 | 16.6 | ||
| 2015 | 17.7 | 22.4 | 21.5 | 19.6 | 18.2 | 20.2 | 17.5 | 16.5 | 16.5 | 18.8 | 16.8 | 16.2 | 18.3 | 19.8 | 18.0 | 17.4 | 18.4 | ||
| 2014 | 27.9 | 26.9 | 20.8 | 23.4 | 23.0 | 25.8 | 23.0 | 21.5 | 21.8 | 26.6 | 22.1 | 25.6 | 26.5 | 22.5 | 23.1 | 23.5 | 23.6 | ||
| 2013 | 29.5 | 33.9 | 29.1 | 24.6 | 24.4 | 23.2 | 24.3 | 23.2 | 22.4 | 24.0 | 25.9 | 15.9 | 25.6 | 25.8 | 23.6 | 23.7 | 24.6 | ||
| 2012 | 34.8 | 31.5 | 26.9 | 30.0 | 27.6 | 22.4 | 21.4 | 23.4 | 22.6 | 25.3 | 31.6 | 25.6 | 30.2 | 28.6 | 22.1 | 25.6 | 26.6 | ||
| 2011 | 34.1 | 33.6 | 26.7 | 34.1 | 32.1 | 23.5 | 38.2 | 32.0 | 19.4 | 27.0 | 26.9 | 21.8 | 26.9 | 31.7 | 31.1 | 24.3 | 28.6 | ||
| 2010 | 35.4 | 28.1 | 22.8 | 27.2 | 21.1 | 22.2 | 29.0 | 24.7 | 19.3 | 26.4 | 38.2 | 34.0 | 32.8 | 24.6 | 25.0 | 25.4 | 26.4 | ||
| 2009 | 13.7 | 29.2 | 24.4 | 25.0 | 20.5 | 21.2 | 22.0 | 22.5 | 23.7 | 18.9 | 21.4 | 23.4 | 21.7 | 23.9 | 21.8 | 21.2 | 22.5 | ||
| 2008 | 24.1 | 27.8 | 22.1 | 19.8 | 25.5 | 17.6 | 24.6 | 22.2 | 19.4 | 15.2 | 25.2 | 22.9 | 24.5 | 21.2 | 20.6 | 18.3 | 21.0 | ||
| 2007 | 17.6 | 20.4 | 19.5 | 24.7 | 23.6 | 16.8 | 16.5 | 23.5 | 13.6 | 27.8 | 36.6 | 22.1 | 20.9 | 23.0 | 17.8 | 24.0 | 21.5 | ||
| 2006 | 27.0 | 30.1 | 22.5 | 27.4 | 10.7 | 15.6 | 25.8 | 28.9 | 21.4 | 22.0 | 16.7 | 14.2 | 21.1 | 22.4 | 23.0 | 20.6 | 21.8 | ||
| 2005 | 10.3 | 15.0 | 21.9 | 24.9 | 15.9 | 17.9 | 20.6 | 20.7 | 19.9 | 27.9 | 23.4 | 16.8 | 14.7 | 21.3 | 19.2 | 23.4 | 19.9 | ||
| 2004 | 15.5 | 23.7 | 19.2 | 18.6 | 15.7 | 11.1 | 13.9 | 19.2 | 17.1 | 19.8 | 14.6 | 12.9 | 16.9 | 17.9 | 13.7 | 17.6 | 16.6 | ||
| 2003 | 19.7 | 22.3 | 21.2 | 21.8 | 14.2 | 16.5 | 17.8 | 15.4 | 17.0 | 20.3 | 23.3 | 18.0 | 19.9 | 19.0 | 16.5 | 19.7 | 18.7 | ||
| 2002 | 29.1 | 31.4 | 23.4 | 24.5 | 23.5 | 16.5 | 21.4 | 13.2 | 15.9 | 24.4 | 24.7 | 17.7 | 25.3 | 23.8 | 16.9 | 20.5 | 21.4 | ||
| 2001 | 26.7 | 26.5 | 26.7 | 30.3 | 23.9 | 25.7 | 24.5 | 22.7 | 17.5 | 23.4 | 27.2 | 17.7 | 23.6 | 27.2 | 24.5 | 21.5 | 24.3 | ||
| 2000 | 35.7 | 24.2 | 30.2 | 23.3 | 32.9 | 10.7 | 25.2 | 20.0 | 20.4 | 31.4 | 22.7 | 22.0 | 26.5 | 28.7 | 18.0 | 25.1 | 24.2 | ||
| 1999 | 29.4 | 21.6 | 21.8 | 19.5 | 16.2 | 21.9 | 26.3 | 17.1 | 17.8 | 26.8 | 33.5 | 27.1 | 25.8 | 19.3 | 21.7 | 25.9 | 23.1 | ||
| 1998 | 16.2 | 22.6 | 16.3 | 8.7 | 10.6 | 9.4 | 17.6 | 9.4 | 9.7 | 17.9 | 25.9 | 10.7 | 15.8 | 12.2 | 11.9 | 14.5 | 13.2 | ||
| 1997 | 6.9 | 19.0 | 11.8 | 10.5 | 12.0 | 6.7 | 7.8 | 14.0 | 20.0 | 8.3 | 11.1 | 6.9 | 10.1 | 11.6 | 9.0 | 11.3 | 10.6 | ||
| 1996 | 19.4 | 10.6 | 17.3 | 24.6 | 13.0 | 17.2 | 12.6 | 8.2 | 5.9 | 17.2 | 13.8 | 18.4 | 15.7 | 18.5 | 12.9 | 11.2 | 14.8 | ||
| 1995 | 18.3 | 10.1 | 8.7 | 17.1 | 12.7 | 19.5 | 24.8 | 9.5 | 18.4 | 13.7 | 28.6 | 20.2 | 15.5 | 13.5 | 19.4 | 19.1 | 16.6 | ||
| 1994 | 23.5 | 39.0 | 41.2 | 18.6 | 29.4 | 15.2 | 13.2 | 13.8 | 12.5 | 19.8 | 16.2 | 18.0 | 26.7 | 29.0 | 14.0 | 16.7 | 22.1 | ||
| 1993 | 18.4 | 26.9 | 27.4 | 26.7 | 36.4 | 39.1 | 12.2 | 18.8 | 21.0 | 18.3 | 23.4 | 20.3 | 22.4 | 30.0 | 23.6 | 21.1 | 24.3 | ||
| 1992 | 30.8 | 22.2 | 18.8 | 18.1 | 34.7 | 20.6 | 6.9 | 14.6 | 25.4 | 27.1 | 28.9 | 10.0 | 21.2 | 23.1 | 14.2 | 27.2 | 21.9 | ||
| 1991 | 18.1 | 18.1 | 20.9 | 19.4 | 19.6 | 16.2 | 10.7 | 28.0 | 34.9 | 35.6 | 39.3 | 30.0 | 20.3 | 19.9 | 17.8 | 36.6 | 22.9 | ||
| 1990 | 47.1 | 44.9 | 30.1 | 24.5 | 23.4 | 34.7 | 27.8 | 26.8 | 36.4 | 34.5 | 31.5 | 32.9 | 43.5 | 25.8 | 29.8 | 34.3 | 34.6 | ||
| 1989 | 52.0 | 52.6 | 44.1 | 47.7 | 40.9 | 41.3 | 48.9 | 42.8 | 45.0 | 50.8 | 46.1 | 54.8 | 53.0 | 44.5 | 44.1 | 47.4 | 47.2 | ||
| 1988 | 47.4 | 44.4 | 56.2 | 50.8 | 37.0 | 42.6 | 40.7 | 45.7 | 47.5 | 43.9 | 49.5 | 52.2 | 47.7 | 46.6 | 42.9 | 47.0 | 46.2 | ||
| 1987 | 36.4 | 20.0 | 40.9 | 48.4 | 40.3 | 43.6 | 45.1 | 34.6 | 43.5 | 40.7 | 48.0 | 40.7 | 39.1 | 43.0 | 40.7 | 44.1 | 42.3 | ||
| 1986 | 38.5 | 39.5 | 47.2 | 44.4 | 51.1 | 29.4 | 43.5 | 27.8 | 16.1 | 49.0 | 44.8 | 37.1 | 38.4 | 47.8 | 32.3 | 38.7 | 40.1 | ||
| 1985 | 0.0 | 10.0 | 0.0 | 2.3 | 7.0 | 1.7 | 12.5 | 23.5 | 0.0 | 5.3 | 30.0 | 28.6 | 12.5 | 3.1 | 7.1 | 10.0 | 6.6 | ||
| 1984 | 0.0 | 0.0 | 0.0 | 0.0 | 0.0 | 0.0 | 3.4 | 3.0 | 7.4 | 5.9 | 12.9 | 2.9 | 2.0 | 0.0 | 2.7 | 8.7 | 4.7 | ||
| 1983 | 0.0 | 8.3 | 0.0 | 15.4 | 11.1 | 7.7 | 0.0 | 0.0 | 0.0 | - | 0.0 | 0.0 | 3.4 | 11.1 | 3.3 | 0.0 | 5.0 | ||
| 1982 | - | 0.0 | - | 0.0 | 0.0 | 0.0 | - | 0.0 | - | 0.0 | - | 0.0 | 0.0 | 0.0 | 0.0 | 0.0 | 0.0 | ||
Breeding data
Breeding records by month
Number of breeding records by breeding code and month, 2017 and all years| Breeding code | Jul | Aug | Sep | Oct | Nov | Dec | Jan | Feb | Mar | Apr | May | Jun |
|---|---|---|---|---|---|---|---|---|---|---|---|---|
| 2017 | ||||||||||||
| Breeding (BLA code) | 0 | 0 | 1 | 0 | 1 | 0 | 0 | 0 | 0 | 0 | 0 | 0 |
| Carrying Food | 0 | 0 | 0 | 0 | 1 | 2 | 1 | 0 | 0 | 0 | 0 | 0 |
| Copulating | 0 | 0 | 1 | 0 | 0 | 0 | 0 | 0 | 0 | 0 | 0 | 0 |
| Display | 0 | 0 | 0 | 1 | 1 | 0 | 0 | 0 | 0 | 0 | 0 | 0 |
| Dependent young | 0 | 0 | 0 | 11 | 5 | 3 | 3 | 0 | 0 | 0 | 0 | 0 |
| Faecal sac | 0 | 0 | 0 | 0 | 0 | 0 | 0 | 0 | 0 | 0 | 0 | 0 |
| Inspecting hollow | 0 | 0 | 0 | 0 | 0 | 0 | 0 | 0 | 0 | 0 | 0 | 0 |
| Nest building | 6 | 2 | 3 | 3 | 1 | 0 | 0 | 0 | 0 | 0 | 0 | 1 |
| Nest with eggs | 0 | 0 | 0 | 0 | 1 | 0 | 0 | 0 | 0 | 0 | 0 | 0 |
| Nest with young | 0 | 0 | 2 | 0 | 0 | 0 | 0 | 0 | 0 | 0 | 0 | 0 |
| On/leaving nest | 0 | 2 | 0 | 2 | 0 | 0 | 0 | 0 | 0 | 0 | 0 | 0 |
| All years | ||||||||||||
| Breeding (BLA code) | 1 | 4 | 6 | 3 | 2 | 1 | 0 | 0 | 2 | 0 | 0 | 0 |
| Carrying Food | 2 | 4 | 7 | 26 | 8 | 5 | 3 | 0 | 0 | 0 | 0 | 0 |
| Copulating | 0 | 0 | 2 | 4 | 1 | 0 | 0 | 0 | 0 | 0 | 0 | 0 |
| Display | 0 | 0 | 0 | 1 | 2 | 0 | 1 | 0 | 0 | 0 | 0 | 0 |
| Dependent young | 0 | 8 | 43 | 129 | 52 | 53 | 33 | 8 | 1 | 0 | 0 | 0 |
| Faecal sac | 0 | 0 | 0 | 0 | 0 | 0 | 0 | 0 | 0 | 0 | 0 | 0 |
| Inspecting hollow | 0 | 1 | 0 | 0 | 0 | 0 | 0 | 0 | 0 | 0 | 0 | 0 |
| Nest building | 31 | 43 | 49 | 59 | 28 | 5 | 4 | 0 | 0 | 0 | 1 | 15 |
| Nest with eggs | 3 | 6 | 4 | 4 | 3 | 0 | 0 | 0 | 0 | 0 | 0 | 1 |
| Nest with young | 0 | 9 | 15 | 26 | 6 | 5 | 1 | 0 | 0 | 0 | 0 | 0 |
| On/leaving nest | 0 | 6 | 10 | 18 | 11 | 2 | 0 | 0 | 0 | 0 | 0 | 0 |
Breeding records by year
Average number of breeding records per period by breeding code| Period | Breeding (BLA code) | Carrying Food | Copulating | Display | Dependent young | Faecal sac | Inspecting hollow | Nest building | Nest with eggs | Nest with young | On/leaving nest |
|---|---|---|---|---|---|---|---|---|---|---|---|
| All years | |||||||||||
| All | 0.5 | 1.5 | 0.2 | 0.1 | 9.1 | 0.0 | 0.0 | 6.5 | 0.6 | 1.7 | 1.3 |
| Previous years | |||||||||||
| All previous years | 0.5 | 1.5 | 0.2 | 0.1 | 8.7 | 0.0 | 0.0 | 6.3 | 0.6 | 1.7 | 1.2 |
| Previous 30 years | 0.6 | 1.7 | 0.2 | 0.1 | 10.1 | 0.0 | 0.0 | 7.2 | 0.7 | 2.0 | 1.4 |
| Previous 20 years | 0.8 | 1.9 | 0.3 | 0.1 | 7.5 | 0.0 | 0.0 | 6.0 | 0.1 | 1.4 | 2.0 |
| 10 year groups | |||||||||||
| [2007,2017) | 1.2 | 2.9 | 0.4 | 0.2 | 11.2 | 0.0 | 0.1 | 9.7 | 0.2 | 2.1 | 3.5 |
| [1997,2007) | 0.5 | 0.9 | 0.2 | 0.0 | 3.9 | 0.0 | 0.0 | 2.4 | 0.1 | 0.8 | 0.6 |
| [1987,1997) | 0.0 | 1.3 | 0.0 | 0.0 | 15.1 | 0.0 | 0.0 | 9.5 | 1.7 | 3.0 | 0.2 |
| 5 year groups | |||||||||||
| [2012,2017) | 1.4 | 2.6 | 0.6 | 0.4 | 10.0 | 0.0 | 0.2 | 11.2 | 0.2 | 2.0 | 3.4 |
| [2007,2012) | 1.0 | 3.2 | 0.2 | 0.0 | 12.4 | 0.0 | 0.0 | 8.2 | 0.2 | 2.2 | 3.6 |
| [2002,2007) | 0.0 | 1.4 | 0.4 | 0.0 | 4.0 | 0.0 | 0.0 | 3.0 | 0.0 | 1.0 | 0.2 |
| [1997,2002) | 1.0 | 0.4 | 0.0 | 0.0 | 3.8 | 0.0 | 0.0 | 1.8 | 0.2 | 0.6 | 1.0 |
| [1992,1997) | 0.0 | 0.2 | 0.0 | 0.0 | 2.8 | 0.0 | 0.0 | 0.8 | 0.2 | 0.2 | 0.4 |
| [1987,1992) | 0.0 | 2.4 | 0.0 | 0.0 | 27.4 | 0.0 | 0.0 | 18.2 | 3.2 | 5.8 | 0.0 |
| Year | |||||||||||
| 2017 | 2.0 | 4.0 | 1.0 | 2.0 | 22.0 | 0.0 | 0.0 | 16.0 | 1.0 | 2.0 | 4.0 |
| 2016 | 0.0 | 6.0 | 0.0 | 2.0 | 12.0 | 0.0 | 1.0 | 25.0 | 0.0 | 5.0 | 9.0 |
| 2015 | 0.0 | 1.0 | 1.0 | 0.0 | 13.0 | 0.0 | 0.0 | 11.0 | 0.0 | 1.0 | 3.0 |
| 2014 | 2.0 | 1.0 | 1.0 | 0.0 | 12.0 | 0.0 | 0.0 | 5.0 | 1.0 | 1.0 | 2.0 |
| 2013 | 3.0 | 2.0 | 0.0 | 0.0 | 8.0 | 0.0 | 0.0 | 5.0 | 0.0 | 1.0 | 2.0 |
| 2012 | 2.0 | 3.0 | 1.0 | 0.0 | 5.0 | 0.0 | 0.0 | 10.0 | 0.0 | 2.0 | 1.0 |
| 2011 | 0.0 | 2.0 | 0.0 | 0.0 | 21.0 | 0.0 | 0.0 | 5.0 | 0.0 | 2.0 | 3.0 |
| 2010 | 1.0 | 4.0 | 0.0 | 0.0 | 22.0 | 0.0 | 0.0 | 15.0 | 0.0 | 1.0 | 3.0 |
| 2009 | 1.0 | 1.0 | 1.0 | 0.0 | 5.0 | 0.0 | 0.0 | 7.0 | 0.0 | 2.0 | 4.0 |
| 2008 | 0.0 | 4.0 | 0.0 | 0.0 | 7.0 | 0.0 | 0.0 | 12.0 | 1.0 | 5.0 | 7.0 |
| 2007 | 3.0 | 5.0 | 0.0 | 0.0 | 7.0 | 0.0 | 0.0 | 2.0 | 0.0 | 1.0 | 1.0 |
| 2006 | 0.0 | 3.0 | 0.0 | 0.0 | 9.0 | 0.0 | 0.0 | 4.0 | 0.0 | 4.0 | 0.0 |
| 2005 | 0.0 | 1.0 | 0.0 | 0.0 | 1.0 | 0.0 | 0.0 | 2.0 | 0.0 | 0.0 | 0.0 |
| 2004 | 0.0 | 0.0 | 0.0 | 0.0 | 3.0 | 0.0 | 0.0 | 2.0 | 0.0 | 0.0 | 0.0 |
| 2003 | 0.0 | 2.0 | 1.0 | 0.0 | 3.0 | 0.0 | 0.0 | 4.0 | 0.0 | 1.0 | 1.0 |
| 2002 | 0.0 | 1.0 | 1.0 | 0.0 | 4.0 | 0.0 | 0.0 | 3.0 | 0.0 | 0.0 | 0.0 |
| 2001 | 0.0 | 2.0 | 0.0 | 0.0 | 6.0 | 0.0 | 0.0 | 5.0 | 0.0 | 2.0 | 1.0 |
| 2000 | 1.0 | 0.0 | 0.0 | 0.0 | 7.0 | 0.0 | 0.0 | 1.0 | 0.0 | 1.0 | 3.0 |
| 1999 | 4.0 | 0.0 | 0.0 | 0.0 | 2.0 | 0.0 | 0.0 | 2.0 | 0.0 | 0.0 | 1.0 |
| 1998 | 0.0 | 0.0 | 0.0 | 0.0 | 2.0 | 0.0 | 0.0 | 1.0 | 1.0 | 0.0 | 0.0 |
| 1997 | 0.0 | 0.0 | 0.0 | 0.0 | 2.0 | 0.0 | 0.0 | 0.0 | 0.0 | 0.0 | 0.0 |
| 1996 | 0.0 | 0.0 | 0.0 | 0.0 | 3.0 | 0.0 | 0.0 | 0.0 | 1.0 | 0.0 | 2.0 |
| 1995 | 0.0 | 0.0 | 0.0 | 0.0 | 4.0 | 0.0 | 0.0 | 2.0 | 0.0 | 1.0 | 0.0 |
| 1994 | 0.0 | 1.0 | 0.0 | 0.0 | 1.0 | 0.0 | 0.0 | 1.0 | 0.0 | 0.0 | 0.0 |
| 1993 | 0.0 | 0.0 | 0.0 | 0.0 | 4.0 | 0.0 | 0.0 | 1.0 | 0.0 | 0.0 | 0.0 |
| 1992 | 0.0 | 0.0 | 0.0 | 0.0 | 2.0 | 0.0 | 0.0 | 0.0 | 0.0 | 0.0 | 0.0 |
| 1991 | 0.0 | 1.0 | 0.0 | 0.0 | 3.0 | 0.0 | 0.0 | 3.0 | 0.0 | 1.0 | 0.0 |
| 1990 | 0.0 | 1.0 | 0.0 | 0.0 | 19.0 | 0.0 | 0.0 | 15.0 | 2.0 | 5.0 | 0.0 |
| 1989 | 0.0 | 6.0 | 0.0 | 0.0 | 51.0 | 0.0 | 0.0 | 32.0 | 4.0 | 9.0 | 0.0 |
| 1988 | 0.0 | 4.0 | 0.0 | 0.0 | 32.0 | 0.0 | 0.0 | 24.0 | 7.0 | 6.0 | 0.0 |
| 1987 | 0.0 | 0.0 | 0.0 | 0.0 | 32.0 | 0.0 | 0.0 | 17.0 | 3.0 | 8.0 | 0.0 |
| 1986 | 0.0 | 0.0 | 0.0 | 0.0 | 3.0 | 0.0 | 0.0 | 3.0 | 0.0 | 0.0 | 0.0 |
| 1985 | 0.0 | 0.0 | 0.0 | 0.0 | 0.0 | 0.0 | 0.0 | 0.0 | 0.0 | 1.0 | 0.0 |
| 1984 | 0.0 | 0.0 | 0.0 | 0.0 | 0.0 | 0.0 | 0.0 | 0.0 | 0.0 | 0.0 | 0.0 |
| 1983 | 0.0 | 0.0 | 0.0 | 0.0 | 0.0 | 0.0 | 0.0 | 0.0 | 0.0 | 0.0 | 0.0 |
| 1982 | 0.0 | 0.0 | 0.0 | 0.0 | 0.0 | 0.0 | 0.0 | 0.0 | 0.0 | 0.0 | 0.0 |
Distribution map
Distribution - 2017
This map shows the observed distribution of the Yellow-rumped Thornbill for 2017.
The red circles are the grid cells where Yellow-rumped Thornbill have been reported.
The transparency of the red circles indicate how many surveys sheets were submitted for that grid cell; the darker the red the more reliable the data. Of the 315 grid cells with reports, 83 had only one sheet; an example is grid number A9.
The size of the circle represents the reporting rate. The maximum reporting rate for Yellow-rumped Thornbill was 100.0% (eg grid number A9) and the minimum was 0.4% (eg grid number K15). 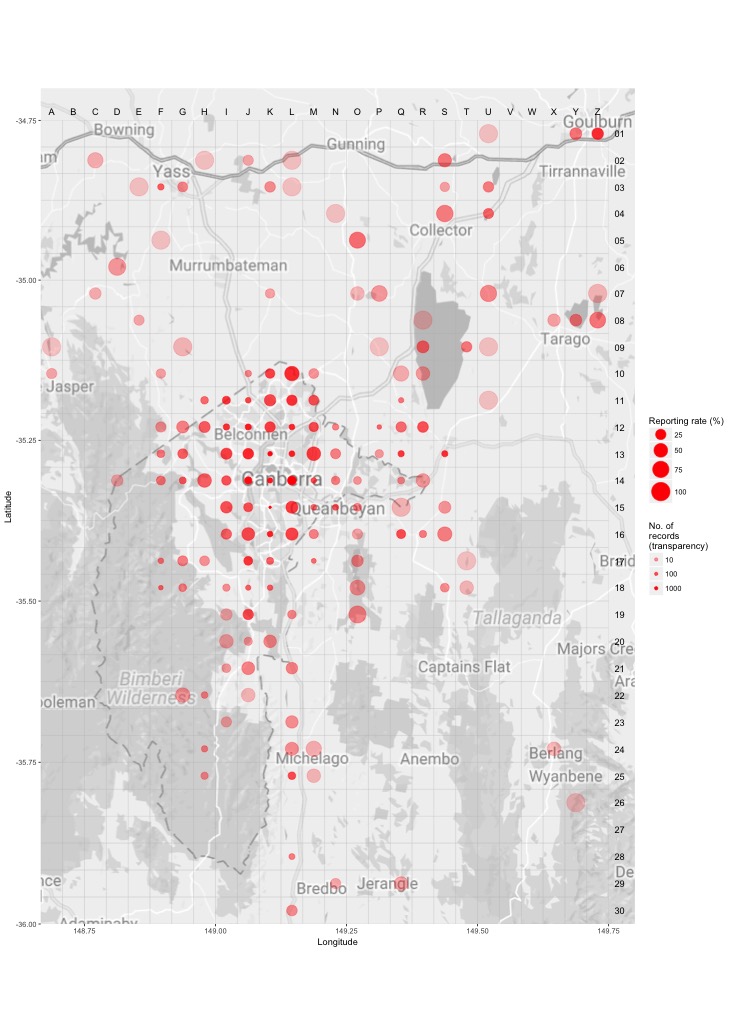
Distribution - all years
This map shows the observed distribution of the Yellow-rumped Thornbill for all years.
The red circles are the grid cells where Yellow-rumped Thornbill have been reported.
The transparency of the red circles indicate how many surveys sheets were submitted for that grid cell; the darker the red the more reliable the data. Of the 703 grid cells with reports, 55 had only one sheet; an example is grid number B13.
The size of the circle represents the reporting rate. The maximum reporting rate for Yellow-rumped Thornbill was 100.0% (eg grid number B13) and the minimum was 0.4% (eg grid number D16). 
Breeding map
Breeding - 2017
This map shows the breeding distribution of the Yellow-rumped Thornbill for 2017.
The red circles are the grid cells where breeding activity for Yellow-rumped Thornbill have been reported.
The size of the circle represents the number of reports. 
Breeding - all years
This map shows the breeding distribution of the Yellow-rumped Thornbill for all years.
The red circles are the grid cells where breeding activity for Yellow-rumped Thornbill have been reported.
The size of the circle represents the number of reports. 